
RAA Community Platform
Explore the global community advancing land restoration and drought resilience.
Global Presence
Initiatives Directory
Resources & Opportunities
Community Snapshot
Partners
Global Presence
Geographic overview of the Land & Soil Community's initiatives across regions and countries.
Pin location
Each pin is placed at the headquarters of the lead partner — or, when all partners share equal responsibility, the headquarters of the partner who submitted the information. It does not necessarily indicate where the initiative's activities are implemented. Geographic scope and specific geography fields on each profile card provide more detail on where the work takes place.
Global
The initiative operates or has impact across multiple continents, or explicitly targets worldwide reach. Global initiatives are not restricted to a specific region or country.
Regional
The initiative focuses on a defined multi-country region — such as the MENA region, Latin America, or the IGAD region — without covering the entire globe.
National
The initiative's primary geographic scope is within a single country, even if it receives international funding or support.
Initiatives Directory
Structured profiles of initiatives within the Land & Soil Community.
Initiative name vs Partner name
Initiative name refers to the specific programme, project, or activity registered in the Land & Soil Community — it is the primary identifier used throughout the directory.
Partner name refers to the organisation leading or hosting that initiative. One organisation may run multiple initiatives; conversely, a single initiative may be co-led by a consortium of partners.
Data collection
All data is self-reported and voluntary, provided by initiatives via a standardized Google Form, linked from the “Join with my initiative” button. Submissions enter the central registry and undergo a curation process before being released to the platform.
Country shown in profile cards
The country displayed on each profile card reflects the headquarters of the lead partner — or, when all partners share equal responsibility, the headquarters of the partner who submitted the information. It does not necessarily indicate where the initiative's activities are implemented. Geographic scope and specific geography fields provide more detail on where the work takes place.
Indicator cards: in action vs projected
Each profile card displays two types of indicators, visually distinguished to avoid conflating confirmed results with future commitments.
Under Action (solid-border cards) show what has already happened or is currently happening: hectares under restoration or conservation, people already benefited, and finance already mobilized. Some partners prefer to report ongoing progress here rather than commit to a fixed Projected number, so this category includes both completed and in-progress figures.
Projected / To Be (dashed-border cards) show planned targets: hectares to be restored or conserved, people to be benefited, and finance to be mobilized. These are partner expectations, not yet realized.
How indicators are distributed on the card
The colored summary cards at the top of each profile always show the final totals — this is the fastest way to scan a card's impact. A detailed breakdown further down the card only appears for hectares (Ha), and only when a partner has published two or more of its sub-components (e.g. both restoration and conservation, or inland waters figures) — in that case, the breakdown shows exactly which figures were added together to reach the total shown above.
People Benefited and Finance Mobilized/to be Mobilized are always single, standalone figures with no sub-components to break down, so they appear only once, in the summary cards at the top.
Why numbers may not add up exactly by eye
All figures on a profile card are rounded for readability (e.g. 8,046,231 is displayed as "8M"). The summary total at the top is calculated from the exact, unrounded underlying data and then rounded once — it is not the sum of the already-rounded figures shown in the breakdown below. Because each figure is rounded independently, manually adding the rounded breakdown numbers can land a little off from the rounded total above — this is expected and does not indicate a calculation error.
People benefited reported in households
Some partners report the number of people benefited in households rather than individuals. When this happens, the RAA team converts the figure to people using the average household size for the initiative's country, sourced from the United Nations Population Division's Household Size and Composition around the World database.
Why some cards show fewer metrics
The RAA community includes initiatives that support the RAA and UNCCD goals both directly and indirectly — this is one reason metrics coverage varies from card to card. In addition, not every initiative is able to publish all of its data on its profile card, even though all submitted data is still included in the aggregate figures shown in the Community Snapshot.
Resources & Opportunities
Curated access to existing platforms, tools and institutional resources relevant to the land and drought agenda.
Platform inclusion
Many of the platforms featured in this section were curated using publicly available information to map the broader land and soil ecosystem. Their inclusion here does not necessarily mean they are RAA partners. Some platforms shown have completed the official platform submission form and are indeed RAA partners.
Looking ahead
We are committed to strengthening our methodology and partnerships in a potential new phase, depending on the level of interest and engagement from the community.
Community Snapshot
Aggregated overview of the Land & Soil Community's scale and composition.
Data collection
All data is self-reported and voluntary, provided by initiatives via a standardized Google Form, linked from the “Join with my initiative” button. Submissions enter the central registry and undergo a curation process before being released to the platform.
Note on Methodology & Data Integrity
This snapshot represents a preliminary effort to demonstrate collective momentum based on self-reported data from our existing community. Following initial curation, individual figures were summed to provide a high-level overview. This is an evolving baseline and work in progress; it will be refined alongside partners to integrate stronger scientific foundations and prevent double counting. This visualization is intended to illustrate community scale and should not be used or cited as an official report.
Scope & limitations
The snapshot aggregates only initiatives that have joined the Land & Soil Community. No ranking, scoring, or independent verification is applied to the reported figures. All submitted data is included here, even for initiatives whose profile cards show fewer metrics due to individual disclosure preferences.
Update frequency
New submissions are not published instantly. Each entry passes through a curation review and, once approved, is released to the platform.
Under Action vs Projected
Under Action values reflect outcomes already delivered or currently being delivered by initiatives between 2015 and 2025. Some partners prefer to report ongoing progress here rather than commit to a fixed Projected number, so this category includes both completed and in-progress figures. Projected values represent the goals set by initiatives for the 2026–2030 period.
Indicators tracked
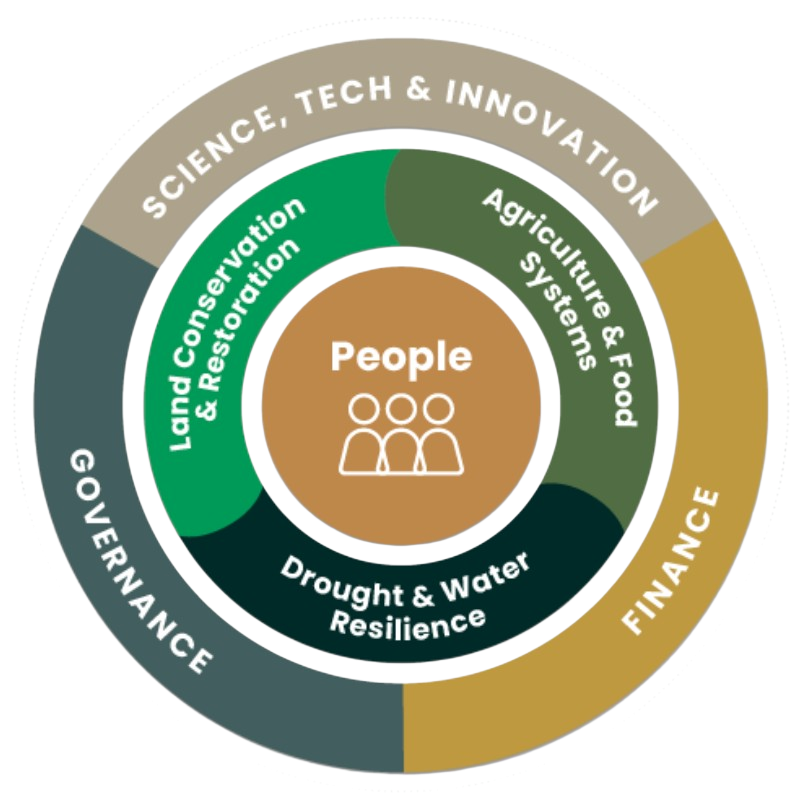
Quantitative (split into Under Action & Projected): hectares under restoration and conservation, inland waters under restoration and conservation, people benefited, and financial resources mobilized.
Categorical: type of actor, geographic scope, region, action area, priority ecosystem, beneficiary, critical enabler, Rio Convention synergies, and alignment with Land & Soil Breakthroughs.
By Region chart
Reflects each initiative’s self-reported geographic scope — the continents where it operates (Africa, Americas, Asia, Europe, Global/International, or Oceania). An initiative may select more than one, so totals can exceed the number of initiatives.
This is different from the Region filter in the Initiatives Directory and the pins on the Global Presence map, both of which are based on the lead partner’s headquarters location rather than where the work takes place.
Restoration vs Conservation
Restoration refers to active interventions to recover degraded land or ecosystems — such as replanting, soil rehabilitation, or rewetting.
Conservation refers to protecting land that is still in good condition from further degradation. Each initiative reports these separately, in hectares and inland waters — though the goal bars below currently combine them into one aggregate figure per category (see “Our methodology will keep evolving”).
Land Conservation & Restoration goal bar
Aggregates both restoration and conservation hectares. Under Action sums hectares currently under restoration and already conserved. Projected sums hectares planned for restoration and conservation. Inland waters are tracked separately under Drought Resilience.
Note on the Projected total: The Nature Conservancy's profile card always shows its full self-reported figure. However, its Projected hectares are excluded from this total — like UCLG's figure under People Benefited, it reflects a worldwide 2030 target rather than directly-additive local hectares, and would otherwise dwarf every other initiative's contribution combined.
Drought Resilience goal bar
Reflects inland water bodies (lakes, rivers, wetlands). Under Action sums inland waters currently under restoration and already conserved. Projected sums inland waters planned for restoration and conservation. Figures are reported in hectares.
Note on the Projected total: for the same reason described under Land Conservation & Restoration, The Nature Conservancy's inland waters figure is excluded from this total — it reflects a worldwide target, not directly-additive local hectares.
Why profile cards and this snapshot don't add up 1:1
Each initiative's profile card shows one combined figure ("Ha Under Action" / "Ha Projected") that adds together land hectares and inland waters hectares — useful for a quick read of that initiative's total impact.
This snapshot instead reports those same hectares split between the two RAA/UNCCD goals they contribute to: Land Conservation & Restoration and Drought Resilience (inland waters). This split is intentional — it tracks progress toward each global target separately — but it means you can't manually sum profile cards and land exactly on one snapshot category; part of each card's total routes to the other category instead.
People Benefited
Under Action reflects people that initiatives report as already benefited. Projected reflects people that initiatives expect to benefit going forward. Both are self-reported and may include direct and indirect beneficiaries as defined by each initiative.
Note on the Projected total: each initiative's own profile card always shows its full self-reported "People to Benefit" figure, including UCLG's Global Taskforce of Local and Regional Governments. However, unlike every other indicator on this platform, the Projected total shown here excludes UCLG's figure from the sum. UCLG reports a global network-reach figure that already spans the vast majority of the world's population, so adding it to every other initiative's figure would double-count the same people rather than reflect genuinely additional reach.
Finance Mobilization goal bar
Finance Under Action reflects financial resources already mobilized by partners. Finance Projected reflects financial resources partners expect to mobilize — these are forward-looking expectations, not confirmed commitments. All figures are in USD and aggregated across all initiatives regardless of individual disclosure preferences.
Multi-value categories
Initiatives may select multiple values per category (action areas, beneficiaries, enablers, etc.). Bar charts count each occurrence, so totals across a category can exceed the number of initiatives.
Land & Soil Breakthroughs
Initiatives flagged as engaged with Land & Soil Breakthroughs are those formally aligned with this partnership at the time of reporting.
Our methodology will keep evolving
We are committed to continuously strengthening our methodology as the platform evolves. If you have ideas on how we should approach it, write to us.
By Type of Actor
By Scope
By Region
By Action Area
By Beneficiary
By Critical Enabler
💰 Finance — Mobilize investment and de-risk capital through instruments such as carbon markets, KPI-linked bonds and debt-for-nature swaps.
🏛️ Governance — Strengthen inclusive, rights-based decision-making and equitable resource allocation, including for historically excluded groups.
🔬 Science, Technology & Innovation — Bridge mainstream science with indigenous and local knowledge to drive data-informed, locally-led restoration.
By Priority Ecosystem
By Rio Synergies
🌱 UNCCD — UN Convention to Combat Desertification
🌿 CBD — Convention on Biological Diversity
🌡️ UNFCCC — UN Framework Convention on Climate Change
🎯 SDG — UN Sustainable Development Goals
All initiatives in this community are aligned with UNCCD by definition. Percentages for CBD, UNFCCC and SDG reflect the share of initiatives that declared alignment with each framework.
Land & Soil Breakthroughs
Rather than creating new initiatives, Breakthroughs provide a unifying framework that connects existing efforts, aligns actors around science-based targets, and makes collective progress visible.
The Land & Soil Breakthroughs are developed under the RAA in connection with the UNCCD space, inspired by the Sharm El-Sheikh Adaptation Agenda.
Partners
Organisations that support the Riyadh Action Agenda and the Land & Soil Community.